
Our Purpose
The Performance Management team is fully dedicated in measuring, monitoring, analyzing, reporting and translating the organization’s objectives into results. Effective planning and data-driven decision making are just some of the direct outputs this team is responsible for.
The vision of the Performance Management team is to take the task of just “measuring” performance and turn it into “managing” performance. In order to achieve this vision, the Performance Management team has set forth goals including:
Delivering a framework that aligns strategic goals with operational activities and provides insight by highlighting leading indicators
Making customer-facing business intelligence (BI) part of the organizational business model
Creating cross-functional teams of IT and business skills to lead the initiative
Evolving BI/Analytics maturity
The Performance Management team aims to consume, use and normalize various datasets throughout the organization to enable strategic and operational decisions to be made. Using a data warehouse architecture, the data collected is being transformed into business intelligence reporting and dashboards that provide details on current and historical critical success factor performance. This type of transparency now makes it easier for the stakeholders to “manage” performance as well as take action where needed.
What is Business intelligence?
Business intelligence (BI) includes the applications, infrastructure/tools and best practices that enable access to and analysis of information to improve and optimize decisions and performance.
Business intelligence (BI) is a term that is getting more attention than ever before. BI includes the applications, infrastructure/tools and best practices that enable access to and analysis of information to improve and optimize decisions and performance. Evolving from the old ways of paper reporting and stagnant reporting/review periods, the ways of BI is now transforming the way organizations use data.
Business intelligence offers organizations many benefits including:
- Gaining valuable insights into strategic imperatives
- Improving organizational effectiveness
- Visualizing important information
- Taking away guesswork
- Current, accurate and complete data for better business decision making
- Improving data quality
- Governance
- Reducing costs
By adopting and implementing a formal BI program, the business can create value by empowering stakeholders with data insights. Having information readily available and current allows critical business decisions to be made without the guesswork.
UCF IT uses Microsoft Power BI. For additional information regarding the application (including application onboarding or licensing information), please reach out to the UCF IT Performance and Service Management Office.
Follow our Progress
The Performance Management team was tasked and challenged to be able to effectively translate measurable indicators of success/progress in each of these focus areas.
The Performance Management team was officially formed late 2015. Based on an assessment completed by the university, there was an identified gap around immature IT service delivery processes and measuring the critical success factors of the organization. Questions such as, are we meeting our customer’s needs or are we meeting our overall objectives, could not be objectively answered.
Following the inception of the Performance Management team, the area of focus became evident. Data to make decisions was disparate, out of date or unavailable. Due to immature processes, the data on hand was neither normalized nor bound by process. Instead of data being used to make informed decisions, data was being overlooked and decisions were being made subjectively.
Two areas of priority were clear. Priority one was being able to objectively measure strategic imperatives for the business and number two was to enable insights into the data to be able to take action and make decisions objectively.
The critical success factors for UCF IT are categorized around four areas of focus as noted below. The Performance Management team was tasked and challenged to be able to effectively translate measurable indicators of success/progress in each of these focus areas.
Customer Service
Providing outstanding service in response to customer needs
Standards
Collaborating to develop and regulate university IT standards based on industry best practices
Capabilities
Providing available, reliable, and scaleable products and services that support the universities enterprise IT needs
Cost
Providing cost effective solutions that maximize value for the university community
The Performance Management team has come a long way since 2015. Faced with the challenge of turning disparate data into actionable information, the team has successfully enabled leadership to begin to make informed decisions using the adopted business intelligence framework. By focusing on each of the critical success factor areas described above, the Performance Management team continues to identify key performance indicators and their related datasets.
Customer Service Dashboard
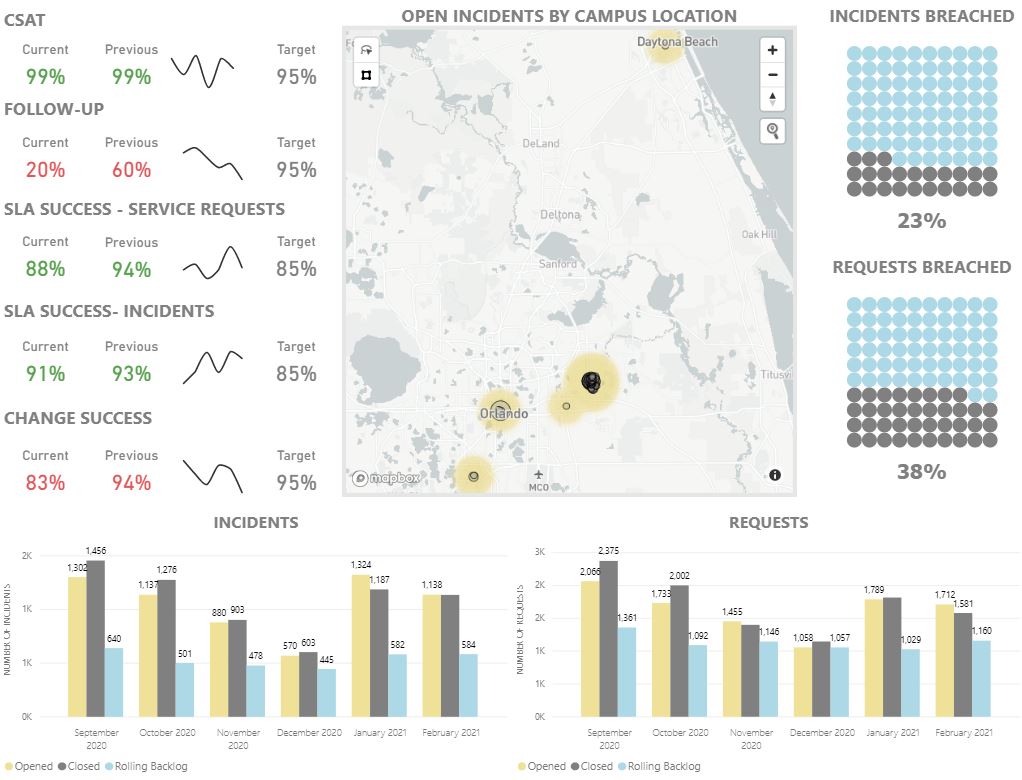
Our first critical success factor dashboard provides insights into our customer service key performance indicators (KPI’s).
CRITICAL SUCCESS FACTOR PROGRESS
CUSTOMER SERVICE
Key performance indicator for overall customer service. CSAT is measured monthly with processes in place when a customer is not satisfied with their service or experience.
If a customer feels we didn’t meet their expectations, a manager follows-up with them asking what they felt went wrong and what we can do to improve.
Key performance indicator measuring the average time it takes to fully resolve or fulfill an incident or service request. Used to correlate customer satisfaction, resource management and service level expectations.
Measures the number of normal and emergency changes that were successful in relationship to the number of changes overall. Using this KPI, we are able to evaluate our unsuccessful changes, introduce corrective actions and achieve a higher percentage of successful change implementations.
Number of Emergency Changes approved by the ECAB (Emergency Change Advisory Board). Measured to assess the number of unplanned changes or critical service degradations that need to be restored as a priority.
SLA success rate refers to the percentage of IT incidents and service requests resolved or fulfilled within the agreed SLA time. As part of the ITIL Continual Service Improvement core area, our SLA’s are reviewed and adjusted (when applicable) to align with changing business needs.
The number of tickets that are pending in the queue without resolution or fulfillment. This KPI provides insights into how teams are managing their existing and incoming demand.
The percentage of tickets that were resolved or fulfilled and reopened by the customer. This provides insight into potential areas of improvement required.
CAPABILITIES
Creating a single pane of glass for university leadership to visualize an overview of current and future work (demand). This will allow resource managers to map out and build capacity plans that will allow team members to ensure work is aligned with university goals.
Evaluating, measuring, and reporting on all infrastructure and platform services. Indicators measured include, aging hardware, unsupported application versions, major upgrades or migrations, maintenance renewals or increasing cost or complexity.
STANDARDS
Implementing and tracking an ITSM balanced scorecard where each process has set of defined measurements.
Implementing and tracking a framework and discipline that translates IT spending, consumption, and capacity into meaningful perspectives for university decisions-makers.
Overall progress is tracked against the business intelligence maturity level. The levels are as follows: Absent, initial, expanding, consolidated and institutionalized.
Progress is tracked along four phases of overall maturity: Elementary, Specialized, Streamlined, and Optimized. Key milestones for successful cloud adoption are contained within five major workstreams: Organizational, Governance, Architecture, Provider Brokerage, Cloud Operations.
We track progress toward each milestone along the five workstreams and across each phase of cloud maturity. We review our overall progress annually, set new goals, and identify specific milestones to focus on in order to achieve those goals.
COST
Organizing and reporting UCF IT activities using the TBM taxonomy and development of a cost model to report and track IT expenditures on a service basis.
Implementing and tracking Apptio’s TBM suite of applications and business analytics to provide the university with facts and insights about technology cost, value and quality, and operational efficiency, as well as comparative bench marking to peer institutions.